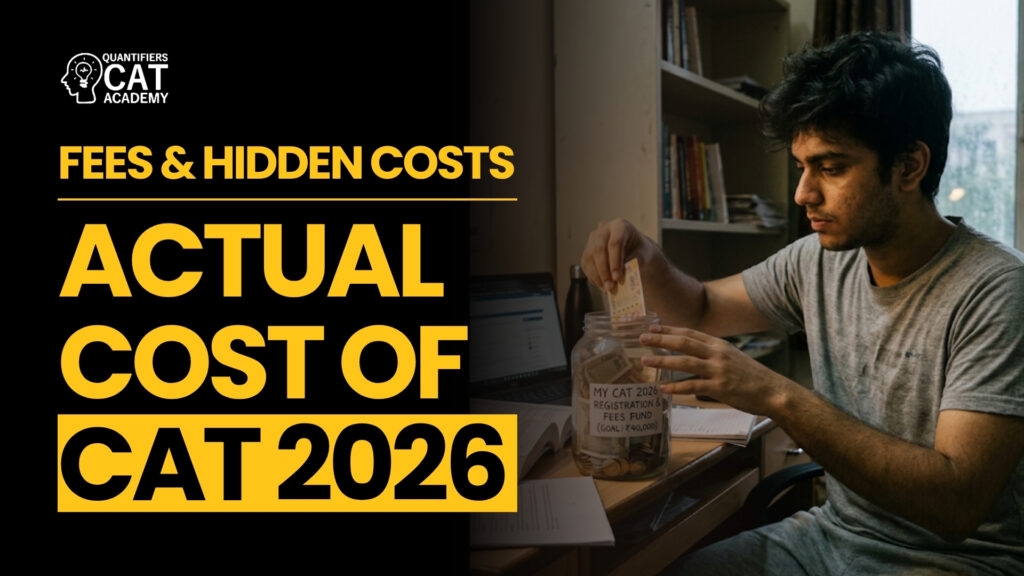


From directions 1, 2, 3, 5, 6; we can fill the table as below.
 From 7th direction, Total number of non CS students failing in one of the two courses : CS student failing in one of the two courses = 3:1
2x:z = 3:1
Z = 2x/3
From 8th direction, z + x =30
5x/3 = 80
X = 18
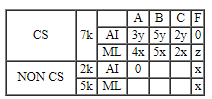
So, we can fill values in the table:
From 7th direction, Total number of non CS students failing in one of the two courses : CS student failing in one of the two courses = 3:1
2x:z = 3:1
Z = 2x/3
From 8th direction, z + x =30
5x/3 = 80
X = 18
So, we can fill values in the table:
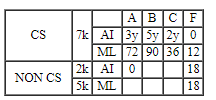 Also, every student take both the courses in CS. So, number of students in AI = number of students in ML = 210
So, total number of students in CS = 210
K = 30
So, in Non CS, AI students = 60, in Non CS, ML students = 150
Also, 3y + 5y + 2y =210 implies y = 21.
So, we can put values for the first row.
Also, every student take both the courses in CS. So, number of students in AI = number of students in ML = 210
So, total number of students in CS = 210
K = 30
So, in Non CS, AI students = 60, in Non CS, ML students = 150
Also, 3y + 5y + 2y =210 implies y = 21.
So, we can put values for the first row.
 By taking 4th direction, we can have the final table as below:
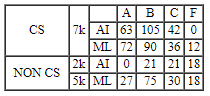 210 + 60 = 270 ans.
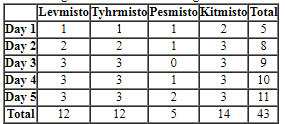 Now we are ready to answer the questions.
The total number of new cases in the city on Day 2 = exactly 8
Now we are ready to answer the questions.
The total number of new cases in the city on Day 2 = exactly 8
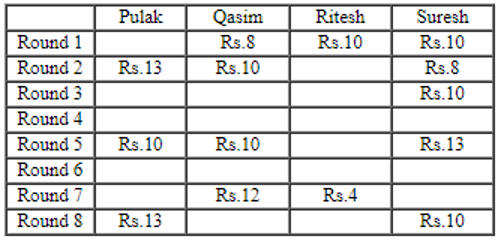
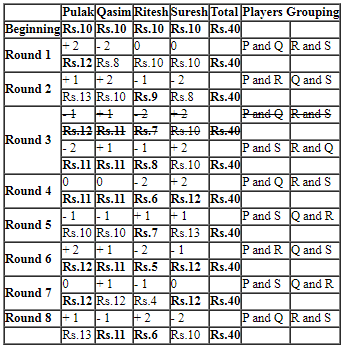 Now we can answer the questions.
Rs.4 is the minimum amount Ritesh has in any round, so he must have won in Round 8 and gained Rs.2. hence, the amount of money that Ritesh had with him at the end of Round 8 = 4 + 2 = Rs.6
Now we can answer the questions.
Rs.4 is the minimum amount Ritesh has in any round, so he must have won in Round 8 and gained Rs.2. hence, the amount of money that Ritesh had with him at the end of Round 8 = 4 + 2 = Rs.6